Dashboard
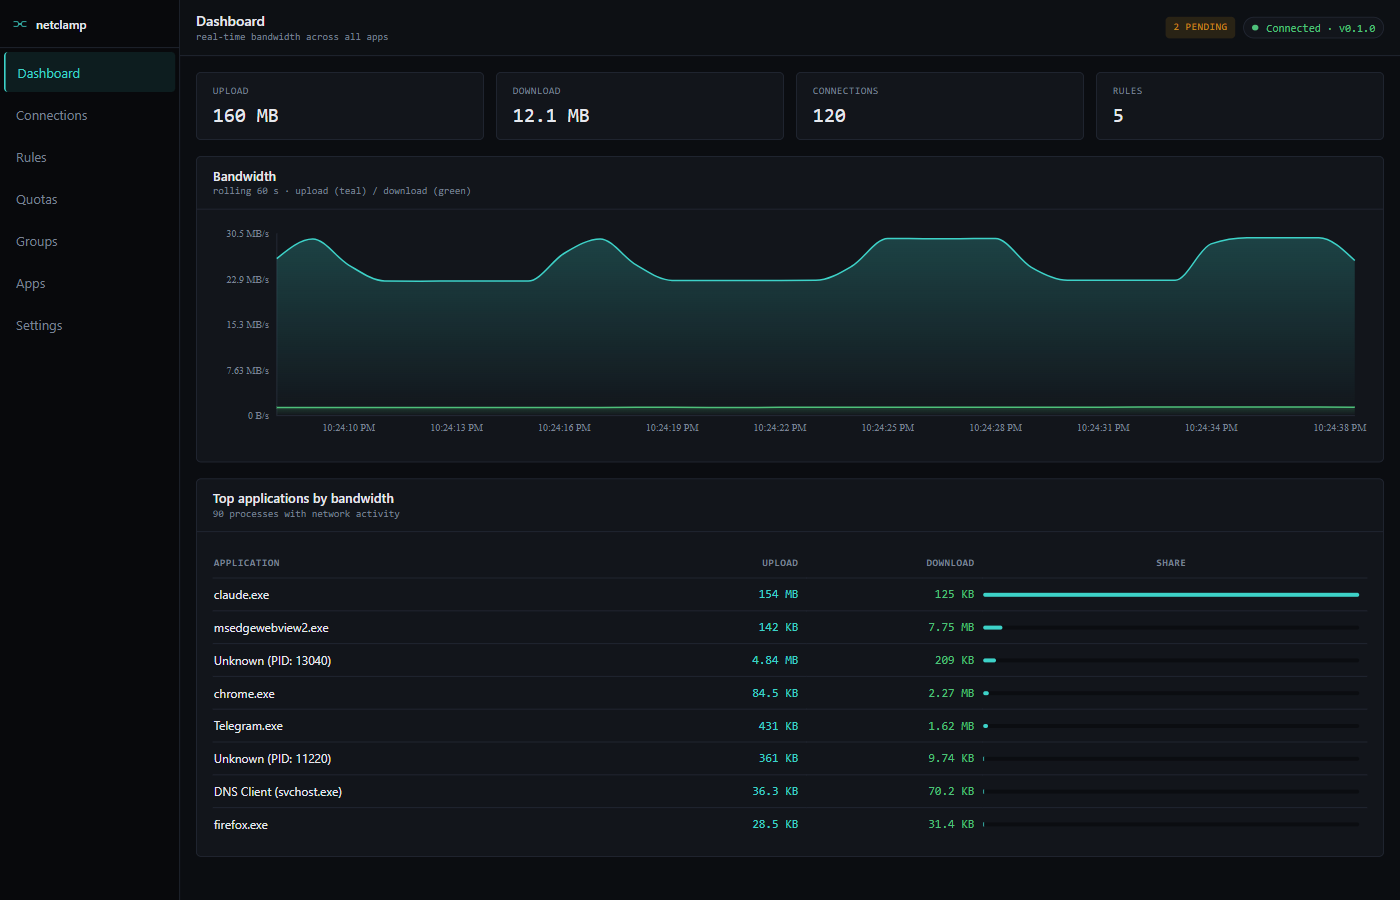
The Dashboard is the default landing page. It surfaces what’s happening on the wire right now.
Top metrics
Four counters across the top:
Upload |
Total cumulative bytes sent since the service booted. |
Download |
Total cumulative bytes received since the service booted. |
Connections |
Currently-active sockets (TCP + UDP). |
Rules |
Number of rules with |
Counters reset when the service restarts. They are NOT a long-term data-usage meter — that’s what Quotas is for.
Bandwidth chart
Rolling 60-second window. Teal line is upload, green line is download. Hovering shows the instantaneous up/down values at that second.
The chart polls /api/v1/throughput every second. If the line goes
flat, the service stopped sampling — check the
troubleshooting page.
Top applications by bandwidth
The largest talkers, sorted by Total (upload + download) descending.
Click an app name to drill into the App detail screen, which has the per-app rate timeline + the option to create a rule pre-filled with that path.
NetClamp’s own binaries are hidden from this list so you can’t accidentally rate-limit your own firewall.
What the Dashboard does NOT show
-
Historical bandwidth (anything older than 60 seconds in the chart). For week-over-week data you want quotas, or pipe the SSE stream into Grafana/Prometheus.
-
Inactive apps. The "Top apps" table only lists processes with non-zero network activity in the current sampling window.
-
Per-rule hit counts. That’s on the Rules page.
Keyboard shortcuts
|
Focus the global search box (when one exists for the screen). |
|
Refresh the dashboard immediately, bypassing the poll interval. |