Apps
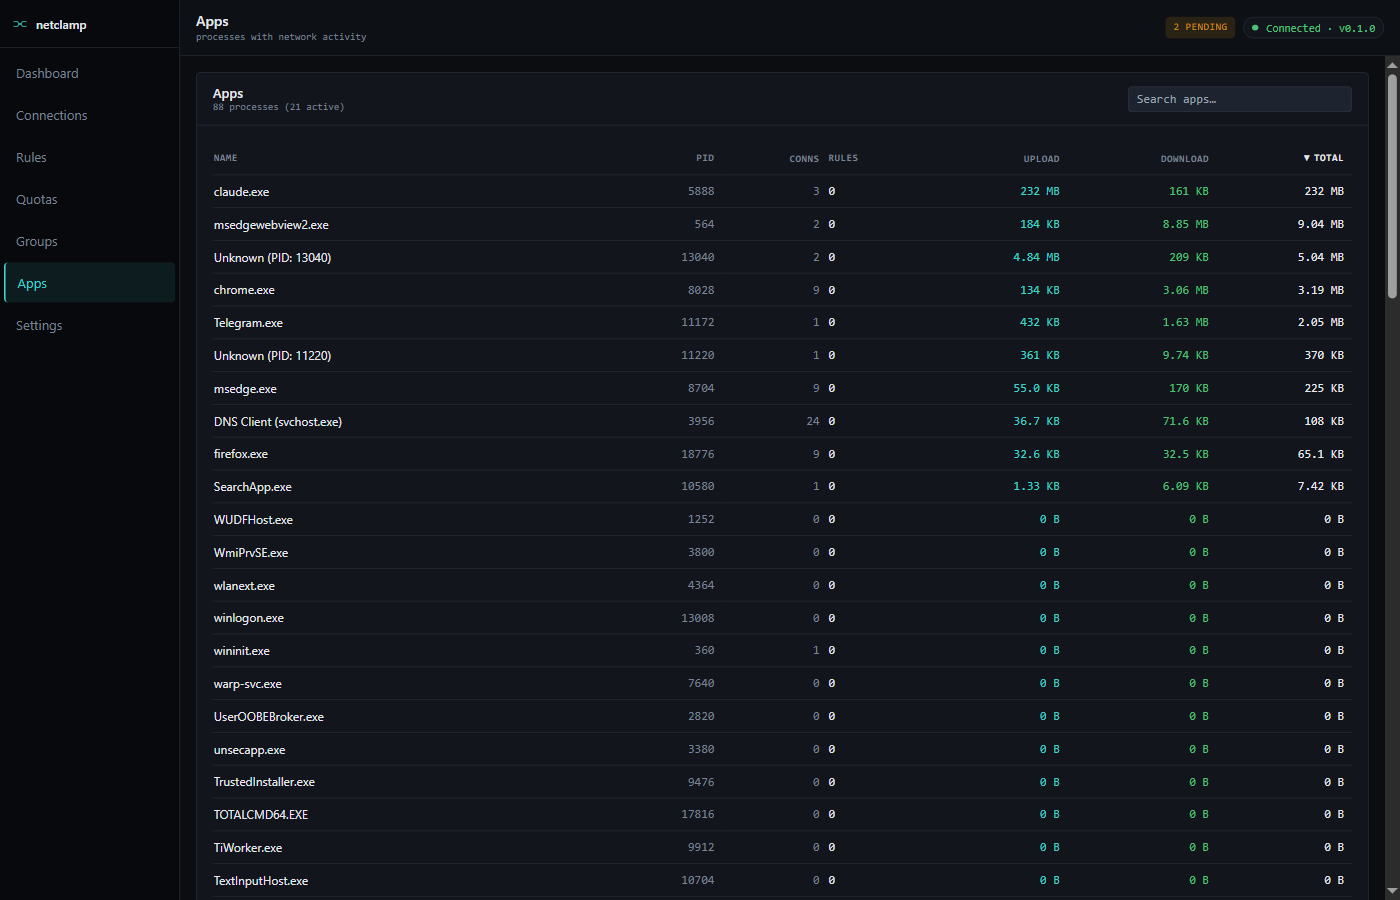
The Apps screen is a sortable table of every process with network activity. Use it to spot the heaviest talkers and create rules with the right path already filled in.
Columns
Name |
Process name. Click to drill into the App Detail screen. |
PID |
OS process id of the active instance. |
Conns |
Active socket count (TCP + UDP). |
Rules |
Rule count targeting this app’s path. Click to filter the Rules screen to just those. |
Upload |
Cumulative bytes sent since service boot. |
Download |
Cumulative bytes received since service boot. |
Total |
Upload + Download. Default sort, descending. |
Search
The search box does substring match on Name. There’s no remote-address filter here (that’s on Connections).
Inactive apps
By default the list shows apps with non-zero traffic in the current sampling window. Toggle "Show all" in the column-header dropdown to include zero-byte rows — useful when you want to pre-create a rule for an app that isn’t talking yet.
App detail (click an app)
Clicking a row opens a detail panel with:
-
Per-app rate timeline — last 5 minutes of throughput, both directions.
-
Active connections — same data as the Connections screen, filtered to this PID.
-
Existing rules and quotas — quick-edit buttons.
-
+ New rule / + New quota — pre-fills the app path so you don’t have to retype.
Self-protect
NetClamp’s own binaries are never shown here. If you need to verify the
service is talking to the loopback API, use netstat -ano | findstr 9845
or the OS Resource Monitor.